

Published platform and photography-vendor materials associate menu photos with orders, but they do not establish a universal highest-ROI change. The figures below describe their reported comparisons; test your own menu instead of treating them as guaranteed outcomes. Treat uplifts as reported ranges to model, not guarantees.
The business case in numbers
Delivery platforms and photography vendors have reported consistent uplifts when items include photos. The pattern is consistent; the exact lift depends on your menu, photos, and market.
| Platform | Reported result | What it represents |
|---|---|---|
| Uber Eats | Average $330 more weekly sales reported when at least 70% of menu items include photos and descriptions | Uber merchant analysis (US&C); results vary |
| Deliveroo | Up to 25% order lift reported when menu photos are added | Deliveroo partner analysis; results vary |
| Just Eat UK | Photos recommended to show dishes and stimulate orders; no quantified uplift published | Just Eat partner guidance |
| Snappr | More than 35% delivery-app order lift and around 25% menu-conversion improvement reported | Snappr vendor materials; not independent |
| DoorDash | Up to 44% higher monthly sales reported for menu items with photos | DoorDash merchant study; results vary |
Useful next: Check delivery specs by platform and reported photo statistics.
Why food photos drive purchasing decisions
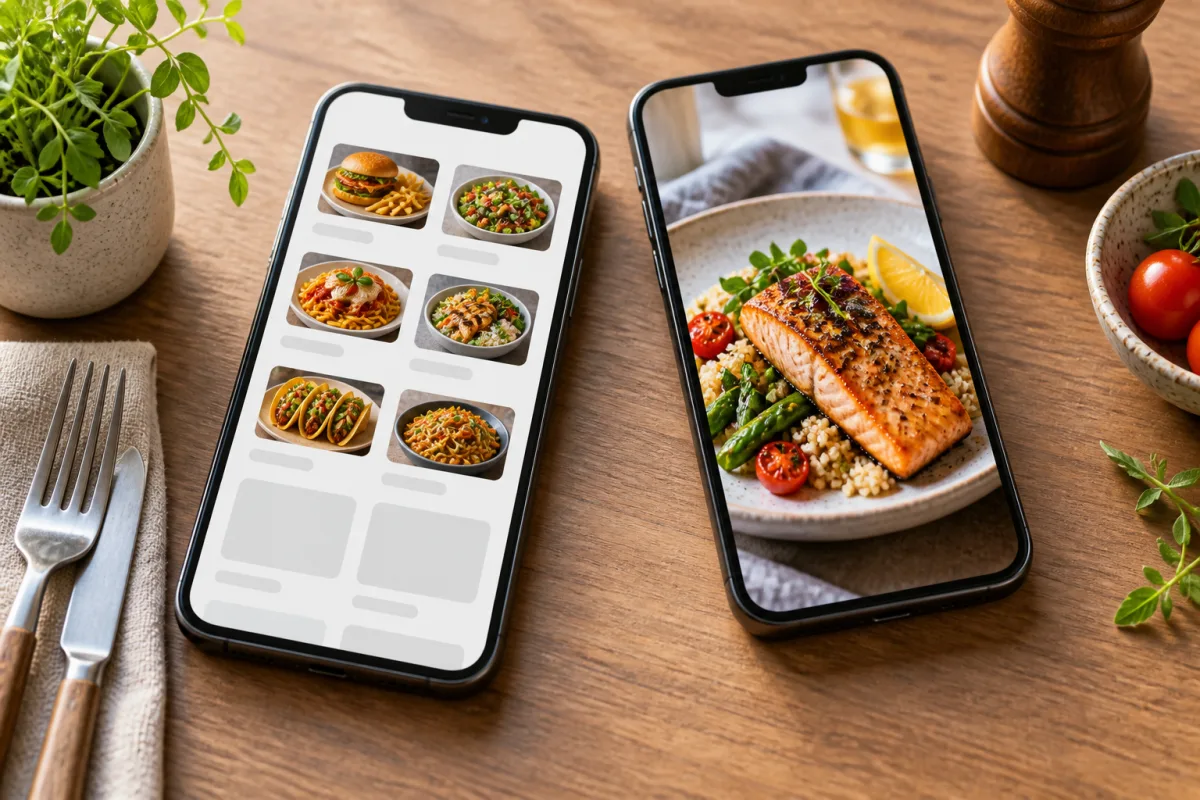
The effect is amplified on mobile, where thumbnail-first browsing means an item with no photo may be skipped. The eye moves to the next card that has one.
As a practical styling choice, warm, natural-looking color and visible texture can help customers understand the dish without changing its promise. Visible texture — char marks on a steak, bubbles in a sauce, layers in a croissant — can communicate flavor through sight. Steam, where visible, signals heat and freshness.
Platform-by-platform photo impact data
Uber Eats, Deliveroo, Just Eat, and DoorDash publish menu-photo guidance or outcome ranges; the linked sources below describe the evidence available for each platform. Ranking, badge eligibility, refund, and complaint effects are not established by those primary sources. Platforms change criteria — verify current rules in your merchant dashboard.
The cost of not having photos
Measurement example: compare the same item’s photo and no-photo conversion over a matched period, then multiply the observed percentage-point difference by your own impressions and average ticket. Do not apply a generic uplift range; your result will vary.
Use your own dashboard as the case study: compare photo and no-photo conversion for matched items or periods, record the observed percentage-point difference and order count, and state the sample size. No DoorDash ghost-kitchen result is claimed here.
Photo rejection delays add a hidden cost. Review time and rejection handling vary by platform and account; check the current merchant dashboard before scheduling a launch. A rejection can delay visibility, so submit early and track status.
AI vs traditional photography ROI comparison
Illustrative budgeting assumptions, not a sourced rate survey or local quotation: A traditional food photographer in 2026 typically runs $300–$800 for a half-day and $800–$2,000 for a full day. Add a food stylist ($200–$500), props and rentals ($100–$300), and post-production retouching ($50–$150 per image), and a professional shoot for 10–20 items costs $600–$2,500. Turnaround to final deliverables is typically 2–3 weeks after scheduling. These cost and timing examples are not measured FoodPhoto results; request actual quotes and turnaround before budgeting.
FoodPhoto can help prepare a real dish photo for a delivery listing, but output compliance requires human review against the current platform specification before publishing. FoodPhoto includes two watermarked previews after account verification, without a card. See current allowances.
Break-even math — 50-item menu at $0.30/photo = $15, modeled against 25% lift on 500 orders x $20 — is an illustration, not current pricing. For current allowances see: https://foodphoto.ai/pricing/
How to measure photo ROI for your restaurant
Use a split-menu test only when your delivery platform’s current merchant tools support controlled experiments. Otherwise compare matched items or periods and record that limitation. Split your menu into two halves: add high-quality photos to one half and leave the other text-only for the test period. Track item-level conversion (orders per menu impression), average basket size, and reorder rate over a minimum of four weeks — this duration accounts for day-of-week variance and avoids weekend or holiday distortion.
Metrics to track:
- Item conversion rate: orders / impressions per item. Compare matched periods and record other changes; this alone does not isolate a causal photo effect.
- Average basket size: whether photo-complete items drive higher attachment of sides, drinks, and extras.
- Reorder rate: a 30-day cohort measure of customers who ordered a photo-complete item and returned vs a text-only item.
- Photo rejection rate: track how many uploaded photos are rejected and the days of delay per rejection.
Use the free ROI calculator on FoodPhoto.ai to model the expected monthly uplift before you start, then compare to actuals after the test.
Key takeaways and next steps
The reported pattern is consistent: photo-complete listings are described as ordering better. The practical question for every restaurant operator is which items to photograph first and how to do it at a cost and speed that makes the investment rational. The answer in 2026 is to use AI enhancement for full-menu coverage and reserve traditional photography for flagship hero shots and brand campaigns.
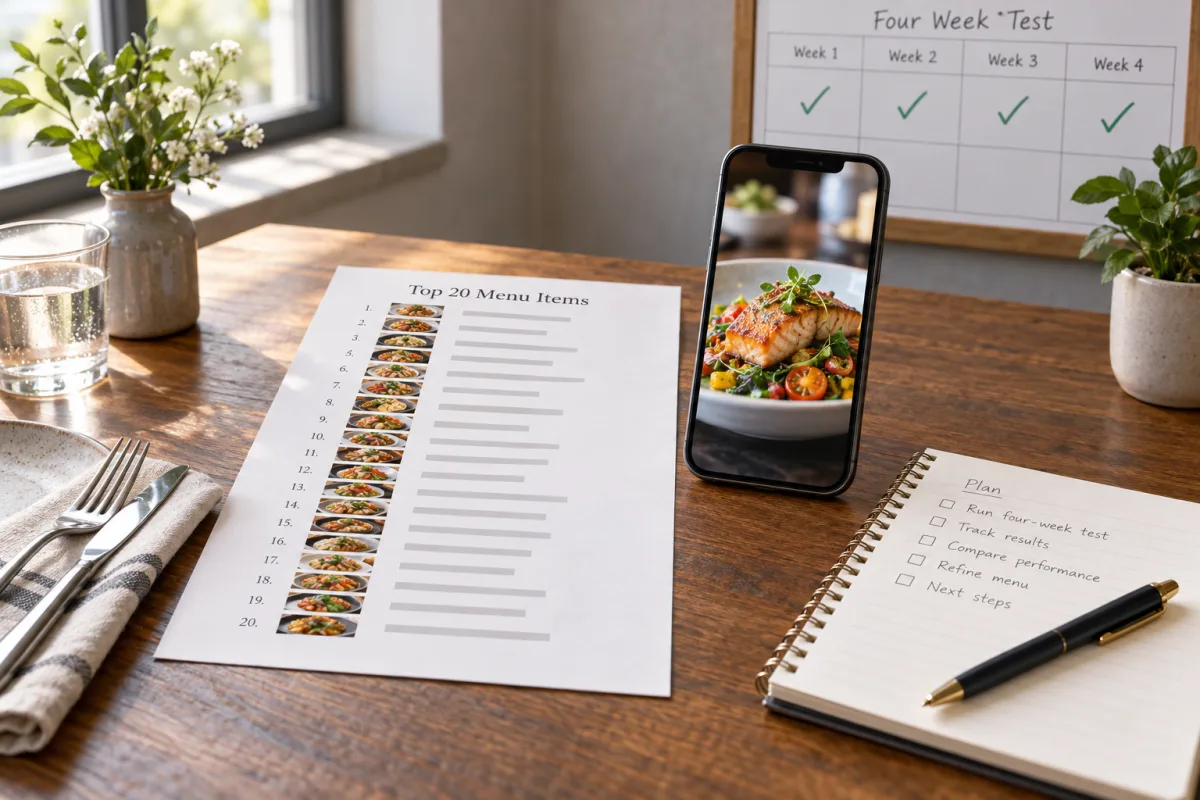
Photo audit action checklist
- Log into your delivery app merchant dashboard and count how many items currently have no photo.
- Rank your menu items by monthly order volume and identify the top 20 — these are your highest-ROI photo targets.
- For each item without a photo, record its own impressions and orders, compare matched periods and model a range using your observed results. Do not apply a universal 25–65% uplift.
- Shoot each item on a smartphone in natural light with a clean neutral background.
- Upload each photo to FoodPhoto.ai, review the result against the current delivery specification, and download it only after it passes.
- Submit to your delivery app and track conversion weekly for four weeks.
Start with two watermarked previews after verification — see your dish in the Studio. Two successful previews free. No card.
Sources and methodology
Source review: October 7, 2026. Uber Eats, Deliveroo, Snappr and DoorDash materials were directly checked. Their figures describe different populations and methods, not a pooled FoodPhoto experiment. Uber’s comparison concerns US&C merchants completing at least 70% photo-and-description coverage in their first seven days. Just Eat’s earlier photo guidance is retained as reported guidance; its current page redirects and could not be independently reread, so no quantified Just Eat uplift is asserted. Four-week testing, top-20 prioritization and the 30-day cohort elsewhere in this guide are FoodPhoto planning suggestions, not guarantees of statistical significance.
These figures come from published platform or vendor materials and are not FoodPhoto tests: Uber Eats reports an average $330 more weekly sales for US&C merchants with photos and descriptions on at least 70% of menu items; Deliveroo says menu photos can boost orders by up to 25%; Just Eat recommends dish photos but does not publish a 4x add-on-order result; Snappr reports more than 35% delivery-app order lift and around 25% menu-conversion improvement in its own materials; DoorDash reports up to 44% higher monthly sales for menu items with photos. Results vary. Test your own top 20 items for four weeks and compare item conversion, basket, and reorder against a pre-photo baseline.
Frequently asked questions
Do food photos really increase restaurant orders?
Published platform and vendor materials report positive associations, but the magnitudes differ and are not FoodPhoto tests. Uber Eats reports a $330-per-week comparison for merchants with at least 70% photo-and-description coverage; Snappr reports more than 35% delivery-app order lift and around 25% menu-conversion improvement in its own materials. Test your own menu.
Which platform rewards photos most in its algorithm?
Uber Eats, Deliveroo, Just Eat, and DoorDash publish photo guidance or outcome ranges, but the primary sources linked above do not establish ranking or badge-eligibility mechanics. Verify current rules in your merchant dashboard.
How quickly do photo improvements show up in orders?
Timing varies by menu, platform, traffic and the other changes made at the same time. The linked sources do not establish a first-week ranking lift or placement by the weekend. Use four weeks as a planning window, record sample size and uncertainty, and extend the observation when the data are sparse; elapsed time alone does not establish statistical significance.
Is AI food photography accurate enough for delivery apps?
FoodPhoto works from a real photo of your dish, but every result needs human review against the original and the current platform content and delivery specifications before publishing.


